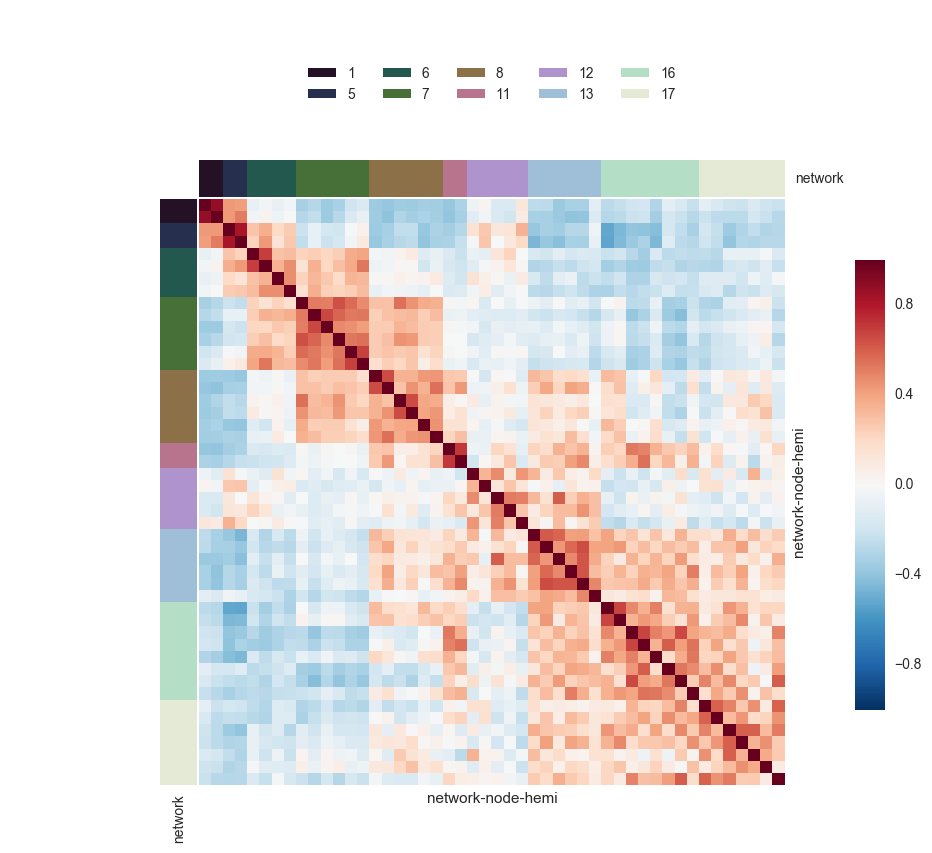
Sometimes, we need to make heatmaps for the matrix data with class information of categorical variables. In this case, we may want to use side color to mark the classes. Since neither matplotlib nor seaborn offer such functionality directly, we have to implement it in an indirect way. Here is some code snippets from Stack Overflow with a bit change to achieve this requirement (The original code does not work for me, so I did some change).
1 2 3 4 5 6 7 8 9 10 11 12 13 14 15 16 17 18 19 20 21 22 23 24 25 26 27 28 29 30 31 32 33 34 35 36 37 38 39 40 41 42 43 44 45 46 47 | %matplotlib inline import pandas as pd import seaborn as sns sns.set(font="Arial") # Load the brain networks example dataset df = sns.load_dataset("brain_networks", header=[0, 1, 2], index_col=0) # Select a subset of the networks used_networks = [1, 5, 6, 7, 8, 11, 12, 13, 16, 17] used_columns = (df.columns.get_level_values("network") .astype(int) .isin(used_networks)) df = df.loc[:, used_columns] # Create a custom palette to identify the networks network_pal = sns.cubehelix_palette(len(used_networks), light=.9, dark=.1, reverse=True, start=1, rot=-2) network_lut = dict(zip(map(str, used_networks), network_pal)) # Convert the palette to vectors that will be drawn on the side of the matrix network_labels = df.columns.get_level_values("network") network_colors = pd.Series(network_labels, index=df.columns).map(network_lut) # Create a custom colormap for the heatmap values cmap = sns.diverging_palette(h_neg=210, h_pos=350, s=90, l=30, as_cmap=True) # Draw the full plot g = sns.clustermap(df.corr(), # Turn off the clustering row_cluster=False, col_cluster=False, # Add colored class labels row_colors=network_colors, col_colors=network_colors, # Make the plot look better when many rows/cols linewidths=0, xticklabels=False, yticklabels=False) # Draw the legend bar for the classes for label in network_labels.unique(): g.ax_col_dendrogram.bar(0, 0, color=network_lut[label], label=label, linewidth=0) g.ax_col_dendrogram.legend(loc="center", ncol=5) # Adjust the postion of the main colorbar for the heatmap g.cax.set_position([.97, .2, .03, .45]) |

